Plotting Californian renewables data using ggplot2
I will be writing a couple of posts in the next month on solar and wind in California. But in advance of that I will write something on how to access and plot wind and solar data for California in R.
First things first. The data. Daily production data for California is available through California ISO (Caiso).
This gives hourly production of geothermal, biomass, biogas, hydro, wind, solar PV and solar thermal.
Unfortunately, Caiso appears to only provide separate data files for each hour. This means we will need to download them all separately. We could do this with a “download all” browser plugin. But here I’ll just do it in R.
The following code does what we need. It downloads all of the data, creating a (somewhat large) data frame with hourly output for all renewables and for all days since the start of 2014. Each file is about 2 kilobytes, so it shouldn’t take that long to download a year and half’s worth of daily data.
options(stringsAsFactors = F)
##### Code to loop through all days after specified date and add that day's output to a data frame
### Packages required
require(lubridate);require(stringr);require(ggplot2);require(plyr)
### Starting date for download. The code will work with anything after 2013-01-01.
### Dates are the absurd American convention of year/month/day. Beware
startD <- ymd("2014-01-01")
### Set the working directory. This is just for saving the download file temporarily before reading it in
setwd("~/Documents/")

for(dd in 1:(365*3) )
{
  ### The code below stops loading in once it gets to a specified day
  if(startD == ymd("2015-05-22"))
    break

  if(startD %in% c(ymd("2014-05-21")) == F)
  {
  #### Create the file name for this day and then download it
  fn <- paste0("http://content.caiso.com/green/renewrpt/",str_replace_all(toString(startD), "-", ""),"_DailyRenewablesWatch.txt")
  download.file(fn,destfile="tmp.txt")
  tmp <- read.csv("tmp.txt", header=TRUE, skip = 1, sep = "\t",nrow = 24)
  ### The people who put these txt files together are not rational. Let's fix that.
  headerF <- data.frame(Names = names(tmp))
  headerF <- subset(headerF, !str_detect(Names, "X"))
  tmp <- tmp[,seq(2, 2*nrow(headerF),2)]
  names(tmp) <- headerF$Names
  ### Add the day of month, month and year to the data frame
  tmp <- data.frame(tmp, Day = day(startD), Month = month(startD), Year = year(startD))
  ### Finally create or add to the data frame, califRE, which stores all of the data
  if(dd == 1)
    califRE <- tmp else
  califRE <- rbind(califRE, tmp)
  }
  startD <- startD + days(1)
}
This creates a data frame called “califRE”, which stores all of the daily data.
As I said, I’ll be writing a couple of posts on the wind and solar data in future. So, I’ll just show one quick plot here, and let you get back to imbibing the morning’s caffeine, or whatever you are doing.
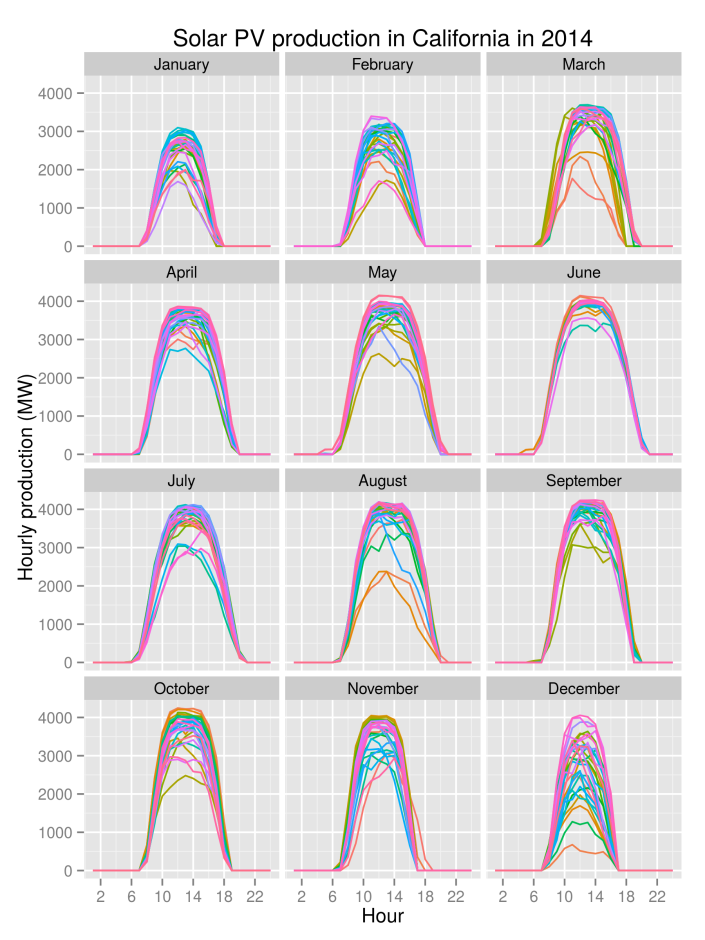
Let’s plot hourly solar PV production each day in 2014. To do this I will use ggplot2, and I will use “facet_wrap” to create a grid which will show hourly output in each day and month.
### Replace the month number with the month name
month.df <- data.frame(Month = 1:12, Name = c("January", "February", "March", "April", "May", "June", "July", "August", "September",
 "October", "November", "December"))
califRE$Month <- join(califRE, month.df)[, ncol(join(califRE, month.df))]
califRE$Month <- factor(califRE$Month, levels = califRE$Month)
##Plot the data
ggplot(subset(califRE, Year == 2014), aes(Hour, SOLAR.PV, colour = factor(Day)))+
 geom_line()+
 facet_wrap(~Month, ncol = 3)+
 theme(legend.position = "none")+
 ylab("Hourly production (MW)")+
 labs("Solar production in California in 2014")
Check back at the end of next week and I will have a blog post up looking at this data in more depth.
3 thoughts on “Plotting Californian renewables data using ggplot2”
Comments are closed.

May 28, 2015 at 12:46 pm
Thanks for this – R is marvellous. On RStudio on Windows I had to replace options(stringsAsFactors = F) by options(stringsAsFactors = FALSE).
LikeLike
May 28, 2015 at 1:00 pm
Rational people don’t use Windows.
LikeLike
May 28, 2015 at 6:42 pm
Oh that’s a tired old meme
LikeLike